Oct
16
Posted by jns on 16 October 2008
In my post about noise yesterday [at my personal blog] I added a rather inscrutable footnote about noise and power spectra. Thoughtfully, Mel asked:
I don’t quite understand this, though: “Pink noise” has a power spectrum that rolls off as the inverse of the frequency. Could you explain what that would look like, for really elementary level brains like mine?
This is just one reason why I love my Canadian friends.
Let’s look at a couple of graphs. It doesn’t even matter that we can’t read the numbers or anything written on the graphs. We don’t have to understand them in any detail, although they’re not very complicated. We get most of what we want to understand just from the shapes of the blue parts.
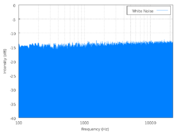
On the left is a power spectrum of white noise (
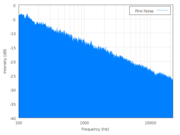
Wikipedia source); on the right is a power spectrum of pink noise (
Wikipedia source). Follow the links and click on the little graphs if you want to see the big versions.
The power spectrum graph plots acoustic power (loosely, how loud the component is) on the vertical axis and frequency on the horizontal axis. Frequency increases towards the right, and frequency is just what you expect: high frequencies are high pitches, low frequencies are low pitches.
If you were looking at the power spectrum of a single, pure tone (like the sounds we used to hear in the US for the emergency broadcasting system test signal, but in recent years they’ve switched to something buzzy), you would see one very narrow, tall blue spike located at the frequency of the pitch in question. If you were looking at the power spectrum of a musical instrument you would see a collection of individual, thick spikes at different frequencies that are part of that instrument’s overtone series and identify its characteristic sound.
But these are power spectra of noise, so they have components at all frequencies, which is why the graphs show solid blue regions rather than a lot of spikes–that blue region is really a huge number of blue spikes at every frequency on the graph.
It’s the shape of the top of the blue region that we want to focus on. In the spectrum on the left, the top is flat (and level), telling us that the loudness of each frequency component in the noise is equal to the loudness of every other component over the entire range we can measure.* That’s white noise: the power spectrum is flat and every frequency component is present with equal loudness.
With pink noise, there is a shape–a specific shape–to the spectrum, as shown on the right. The top of the blue region slants downward on the right side, meaning that the loudness of any given component of the noise decreases as the frequency increases. That’s all I meant by “rolls off” really, that the curve goes down as the frequency goes up.
With the pink noise, as I said, the shape is specific. The top of the curve slants to the right but it is a flat slope† and, for pink noise, it has a specific slope indicating that the loudness (actually the “power spectral density”, but let’s fudge it a bit and just say “loudness”) is changing exactly as the inverse of the frequency (1/f).
You can guess there’s a lot more mathematics one can delve into, but that’s more than we needed anyway. Once you see the idea of loudness vs. frequency for the graphs (“power spectra”), you can see the difference between white noise (totally flat spectrum) and pink noise (“rolls off as 1/f”).
You can hear the difference, too. Those two Wikipedia pages I linked to above have very short sound samples of synthesized white noise (approximate) and pink noise (approximate). If you listen you will notice that the white noise sounds very hissy (as I said, like TVs did in analog days when stations were off the air)–that’s because of all the relatively loud, high-frequency components. On the other hand, the pink noise sounds kind of like hearing noise under water, because the lower frequencies predominate in pink noise (water tends to filter out high frequency sounds).
———-
*This is where practicalities come into play. Theoretical white noise would have frequency components at every possible frequency, but in practice a sound like that cannot be produced, if for no other reason than that the sound could not have gone on forever, so there are low (very, very, very low) frequency components that could not be present because there wasn’t time. Besides, audio equipment doesn’t recreate all frequencies equally, etc., and that’s why the graph of the white noise on the left isn’t exactly level but tilts up slightly towards the right side. And, of course, the top edge is fuzzy and jaggy because this is noise, and noise is random. If you were watching this on a device that measured power spectra (a spectrum analyzer–nice, but very expensive), you’d see the jagginess dance around randomly but, on average, the top would remain flat and level.
† The graphs have logarithmic vertical and horizontal axes, with power given in decibels. However, I don’t think we need to complicate our understanding with that right now, just so long as we accept that in this kind of graph this particular straight-line slope down to the right represents the mathematical 1/f shape.
Oct
10
Posted by jns on 10 October 2008
At the most recent presidential so-called “debate” (that would be debate #2, the “town hall meeting” format), John McCain, trying to score cheap points against rival Barack Obama, referred to earmark money Obama voted for that included “$3 million for an overhead projector at a planetarium in Chicago, Illinois”.
Of course, as many of us knew at the time, and as many, many more now know, that “overhead projector” was actually a sophisticated piece of optical equipment, a Zeiss Mark VI star projector, the programmable star projector that recreates a view of the heavens on the ceiling of planetariums. These instruments are slightly different from an “overhead projector”.
The Adler Planetarium even felt the need to defend its honor with a press release commenting on the issues. From that press release:
To clarify, the Adler Planetarium requested federal support – which was not funded – to replace the projector in its historic Sky Theater, the first planetarium theater in the Western Hemisphere. The Adler’s Zeiss Mark VI projector – not an overhead projector – is the instrument that re-creates the night sky in a dome theater, the quintessential planetarium experience. The Adler’s projector is nearly 40 years old and is no longer supported with parts or service by the manufacturer. It is only the second planetarium projector in the Adler’s 78 years of operation.
Science literacy is an urgent issue in the United States. To remain competitive and ensure national security, it is vital that we educate and inspire the next generation of explorers to pursue careers in science, echnology, engineering and math.
My bold, of course, to highlight why you should support Ars Hermeneutica’s mission.
McCain’s science illiteracy, as illustrated by this remarkably foolish gambit, is dangerous enough. (Either he didn’t know, or he did know and willfully used this tasty sound-bite about the “overhead projector” to prey on the electorate’s illiteracy.) However, I’m sure that he didn’t come up with this earmark tidbit–someone on his staff did. Someone on McCain’s staff should have been able to say “Wait a minute, John. That’s not an overhead projector–that’s one of those really expensive, complicated planetarium thingies!”
We can’t afford scientifically illiterate leaders, nor can we afford scientific illiteracy among their staff.
As we are inclined to say at Ars: “C’mon, it’s not as if it’s rocket science we’re talking about!”
Sep
26
Posted by jns on 26 September 2008
Once again Physics News Update delivered what I thought was a really cool story. It concerns an incredibly bright gamma-ray burst from an incredibly distant object–more distant than anything ever seen before: 7,000,000,000 light years away!
The object exploding was an old star that had used up all its fuel, the end of the sequence in which hydrogen is fused into helium, helium is fused into carbon and oxygen, later products fuse into ever heavier elements until the end of the line is reached with lead as a final product in that sequence. When the fusion sequence ends, there is no outward pressure to balance gravity and the star collapses. Its outer shell is blown off, the core can be compressed to a black hole, and the violence can create shock waves of outward expanding gases (that are dispersing those heavy elements around the universe) that interact explosively with each other and give off exceedingly brilliant bursts of electromagnetic radiation — the gamma-ray bursts. For a fantastic description of these last moments in the life of a supernova, you might like to read my posting “A Star Explodes in Slow Motion“.
So brilliant was the end of this start that, as mentioned below, it would have been visible to the naked eye in full sunlight, had you been looking. Fortunately for science, the satellite known as Swift did see it, and had time to let other observers now. And how interesting to remember that this explosion happened 7 billion years ago.
———-
FURTHEST SEEABLE THING.
For the first time in history you could have looked half way back to the origin of the universe with your naked eye. On the night of March 19, 2008 a telescope mounted in space observed a flash from a gamma ray burst, an extremely explosive celestial object, which set several records.
First, if you’d been looking in that direction you would have been able to see, with your own unaided eyes, something at a distance further–seven billion light years–than anything a human being has ever seen in history. Second, since looking out into space is equivalent to looking back in time (it takes the light from distant objects many years to reach the Earth), you would have been witnessing the earliest thing ever seeable by the naked eye.
A new report describes observations made of the explosion by an orbiting telescope called Swift and by some of ground-based telescopes that got in on the action once they were notified by Swift. Swift has three onboard detectors which look not at ordinary visible light but at much more energetic light in the form of x rays and gamma rays. One feature of Swift’s mission is that as soon as it sees something interesting it alerts controllers on the ground so that other telescopes can be turned in that direction. In this way the explosive outburst, whose official name is GRB 080319B, could be tracked by telescopes sensitive to other kinds of light, such as infrared and even radio waves.
The March 19 event is an example of a gamma ray burst. This comes about when certain heavy old stars have used up all their internal fuel. When a star has no more fuel, the force of gravity causes it to contract. If this process is violent enough, the star can blow apart as a supernova. In some special cases, what is left behind is a black hole, and outward going shock waves which, when they criss-cross, can create a brilliant flash of light. For a short time this light is more powerful than that coming from an entire galaxy of stars. The cone of energy flying away from the explosion can be quite narrow, so to be observed from far away, as this object was, it had to be aligned just right to be seen by Swift.
This gamma burst was not the furthest ever observed with a telescope, but it was the brightest in terms of the energy released. So bright, in fact, that it could have been seen unaided in areas of North and South America the night of March 19, if only for about 40 seconds. The splash of light arriving at Swift’s place in orbit that two of Swift’s three detectors were temporarily blinded. Fortunately several telescopes quickly maneuvered into position and could study the stellar explosion as it unfolded. By then the gamma rays, the most energetic part of the light blast, would have died down.
But other types of light continued to issue from the scene. According to Swift scientist Judith Racusin, an astronomer at Penn State, this has become the best-observed gamma ray burst, and the observations have already changed the way we think about bursts work. When you look out at the night sky about 3000 stars are visible. Everything you can see at night is either a planet in our home solar system or one of those stars, all of which are located in our home galaxy, the Milky Way.
The furthest thing you can normally see with the naked eye, and with some difficulty, is the Andromeda Galaxy, about 2.5 million light years away. Only about once a century is a supernova visible from any further galaxy. And by now it’s been 400 years since we’ve seen one of those. That makes GRB 080319B all the more impressive. It breaks the record of most distant seeable-with-the-naked-eye thing by a factor of a thousand.
Located in the Bootes Constellation, the gamma burst is at a distance of 7 billion light years, which means that it took light seven billion years to come from the blast to Earth. That means that a person seeing the visible portion of the blast would have been looking halfway back toward the time of the big bang, when, according to modern cosmology, the universe began. When the blast occurred the sun hadn’t even appeared yet, much less the Earth, much less the human species. (The results appeared [in] Nature magazine, 11 September 2008.)
[Phillip F. Schewe, James Dawson, and Jason S. Bardi, "Physics News Update -- The American Institute of Physics Bulletin of Research News", American Institute of Physics, issue #873, 25 September 2008.]
Sep
24
Posted by jns on 24 September 2008
The following news arrived in my email recently as a “Physics News Update” item. I thought it interesting enough to share.
———-
CALIFORNIA TREES NOT KEEPING UP WITH CO2.
Forests aren’t absorbing as much carbon dioxide as in the past, and fire suppression might be to blame. Fire suppression in forest encourages the growth of smaller trees and, as a result, significantly reduces a forest’s overall ability to store carbon, according to a new study by scientists at the University of California at Irvine. The researchers, studying forests in California, found that while the number of trees per acre increased in the sixty year period between 1930 and 1990, carbon storage actually declined about 26 percent. This change in the nature of the forests, with greater numbers of smaller trees at the expense of large trees, seems to have been caused by the assiduous suppression of fires by human intervention, the researchers said. Using detailed records, the scientists, compare forests as they were in the 1930s with forests in the 1990s and found that the “stem density” of the forests had increased, which would seem to enhance a forest’s ability to store carbon. In fact, the smaller-tree factor outweighs the denser-forest factor because large trees retain a disproportionate amount of carbon, the researchers concluded.
Climate change, or at least the vast increase in carbon dioxide launched into the atmosphere by the combustion of fossil fuels during the industrial era, has focused scientific attention on the ability of plants, especially trees, to take up and store the added CO2. Trees are not the only carbon sinks (the oceans store vast amounts of CO2), but they are often cited as a key indicator in the fight to stabilize the buildup of greenhouse gases in the atmosphere.
This study, published last month in the journal Geophysical Research Letters, pertains to California only, but Aaron Fellows, one of the study’s authors, believes it will apply to other dry conifer (evergreen) forests in the U.S. western region.
[Phillip F. Schewe, James Dawson, and Jason S. Bardi, "Physics New Update : The American Institute of Physics Bulletin of Research News", #872, American Institute of Physics, 17 September 2008.]
Sep
22
Posted by jns on 22 September 2008
A couple of weeks ago, when the world did not end by getting sucked into a black hole newly created by the just-energized Large Hadron Collider (at CERN), it seemed that journalists were casting their lines very widely to find any related story about physicists and CERN and human- or hadron-interest that they could write to cash in on the high-tech apocalyptic anxieties. Case in point: a piece in the Wall Street Journal (referenced below) about a group of scientists at CERN taking part in an experimental workshop program in improvised comedy. The reported justification is that it might help them with their lateral thinking about such allegedly abstruse topics as the Higgs boson. Myself, I think they’re just a little stir crazy from being underground all the time.
But, the piece did report on a few jokes that, it says, physicists tell. To be honest, I hadn’t heard them before. (Well, to be really honest, I’d heard them a day or two before at a rehearsal, told by another cast member who evidently reads the Wall Street Journal.) However, I haven’t moved in physics circles for several years now.
One of the reported jokes: A neutron walks into a bar and asks how much the drinks are. The bartender says: “For you, no charge.”
That’s pretty funny, sure. But they saved the real knee-slapper for the end of the article:
And consider the following one-liner, delivered in the CERN cafeteria by Mr. [Stephen] Goldfarb[, a physicist working at CERN]: “Two protons walk into a black hole.” That’s the joke.
[Alexander Alter, "Two Protons Walk Into a Black Hole, And Other Jokes Physicists Tell", Wall Street Journal, 4 September 2008.]
I am not kidding when I say that this one still makes me laugh every time, although I think it would be slightly funnier this way:
Two photons walk into a black hole….
Aug
25
Posted by jns on 25 August 2008
Spending a bit of time online with Richard Dawkins (I was spending time with him whereas he spent no time with me–the net works that way), I listened to a reasonably interesting TED talk in which Dawkins talked about how our perceptions of reality are shaped by the evolution of our brains to help us get around in the universe at the size that we are.
That’s interesting enough, but what I want to preserve here is this perceptive and useful little exchange ascribed to the philosopher Wittgenstein, also on the subject of perceptions of reality and the “obvious”. It’s a lovely mini-drama and a useful point to remember.
Wittgenstein: Tell me, why do people always say it was “natural” for man to assume that the Sun went ’round the Earth rather than that the Earth was rotating?
Friend: Well, obviously, because it just looks as though the Sun is going ’round the Earth.
Wittgenstein: Well, what would it have looked like if it had looked as though the Earth was rotating?
[Richard Dawkins, "Queerer than we can suppose: the strangeness of science", TED talk, July 2005.]
Aug
18
Posted by jns on 18 August 2008
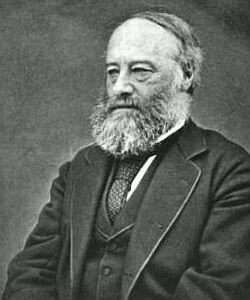 This is British physicist James Prescott Joule (1818-1889), the same Joule who gave his name (posthumously) to the SI unit for energy. Wikipedia’s article on Joule and his most noted contribution to physics is admirably succinct:
Joule studied the nature of heat, and discovered its relationship to mechanical work (see energy). This led to the theory of conservation of energy, which led to the development of the first law of thermodynamics.
At the time that Joule was doing his work, heat was still thought to be caused by the presence of the substance “caloric”: when caloric flowed, heat flowed. That idea was coming under strain thanks largely to new experiments with electricity and motors and observations that electricity passing through conductors caused the conductors to heat up, a notion that proved incompatible with the theory of caloric. This was also still early days in the development of thermodynamics and ideas about heat, work, energy, and entropy had not yet settled down into canon law.
Joule found that there was a relationship between mechanical work (in essence, moving things around takes work) and heat, and then he measured how much work made how much heat, a key scientific step. His experiment was conceptually quite simple: a paddle in a bucket of water was made to turn thanks to a weight falling under the influence of gravity from a fixed height. As a result the water heated up a tiny bit. Measure the increase in temperature of the water (with a thermometer) and relate it to the work done by gravity on the weight (calculated by knowing the initial height of the weight above the floor).
In practice, not surprisingly, it was a very challenging experiment.* The temperature increase was not large, so to measure it accurately took great care, and Joule needed to isolate the water from temperature changes surrounding the water container, which needed insulation. Practical problems abounded but Joule worked out the difficulties over several years and created a beautiful demonstration experiment. He reported his final results in Cambridge, at a meeting of the British Association, in 1845.
Joule’s experiment is one of the ten discussed at some length in George Johnson, The Ten Most Beautiful Experiments (New York : Alfred A. Knopf, 2008, 192 pages), a book I recently finished reading and which I wrote about in this book note. It was a nice book, very digestible, not too technical, meant to present some interesting and influential ideas to a general audience, ideas that got their shape in experiments. Taken together the 10 essays also give some notion of what “beauty” in a scientific experiment might mean; it’s a notion intuitively understood by working scientists but probably unfamiliar to most nonscientists.
__________
* You knew that would be the case because people typically don’t get major SI units named after them for having done simple experiments.
Aug
15
Posted by jns on 15 August 2008
Awhile back I was doing my lunchtime reading in the very interesting book The two-mile time machine : ice cores, abrupt climate change, and our future, by Richard B. Alley. In short, the book is about deep ice cores taken from the ice cap in Greenland and the incredible amount of information they give us about climate in ancient and prehistoric times and then expands on all matter of topics impinging on paleoclimatology, a word that just sounds cool to me (no pun intended). I loved the book and recommend it highly for a number of reasons; my book note is here. Overall the book is a careful and considered look at the history of climate change and the potential for humans to affect it.
I marveled. Even though I am a scientist and I’m accustomed to a naturalistic and reductionist view of the natural world, it is still incredible sometimes to see just how well amazingly intricate and lengthy deductions about how nature must operate actually do work together, fitting one to another like the most precise gears to make a clockwork mechanism of surprising accuracy and precision.
Detractors of science and those who lob in their bizarre “theories” from the fringe usually do not appreciate that new scientific theories are exceedingly constrained things. Any new theory not only has to provide an explanation for some new and troublesome observation, but it has to explain everything in its domain that was explained by the theory it replaces, and it must coexist harmoniously with the very large number of existing theories that surround it in the system of science. That’s rarely an easy task.
So I marveled. From those two-mile long ice cores flowed an amazing amount of intricate analyses and consequent deductions about the history of climate before there were humans to record it–or even think of recording it. One could look at the layers of the ice core like tree rings–and fit some of those observations with tree-ring timing. They could tell how much snow fell. They could measure the conductivity of sections of the ice core. They could analyze the relative abundance of gases at various times by actually measuring tiny bubbles of air trapped in the ice. Mass spectroscopy told them about the relative abundance of heavy water and how it varied in the past 100,000 years.
Ah, but that’s just the beginning. From some of those observations they first had to build a reliable way of measuring time, answering the question: how old is a particular layer of ice core? Deductions there had to give a consistent picture with every other dating technique it could be made to line up with. Then one could start to build a picture of what the climate was doing, and every deduction was made in a milieu of other deductions and existing scientific knowledge so that everything cohered.
Accomplishing that is an amazing feat although it is what science does all the time. Every bit of scientific theory and observational data is continually subjected to a barrage of attacks from all sides probing for any inconsistency with existing knowledge. It’s a remarkable process, but it’s maybe even more remarkable that it works at all. That may be the crowning achievement of science.
Of course, the mystery is that it is even possible to create such a coherent whole. This, of course, is the point Einstein was making when he said “The most incomprehensible thing about the universe is that it is comprehensible.”*
While pondering this great mystery I had a brief moment–a very brief moment–of feeling sorry for people like young-earth creationists and “intelligent-design” creationists, a group that is rarely the object of my pity. But think for a moment on these pitiable ones and all others whose core belief is that their god created all the details of the universe that they can see and the explanation for all of it is “god did it that way”.
Young-earthers see–must see–”nature” as a capricious trickster with, for example, fossils laid down according to the whim of their creator and thus allowing no meaningful patterns to be observed, no deductions to be made, no connections to any other physical phenomenon save through the arbitrary hand of their creator. There is no sense that observations must make a coherent whole, nor that historic puzzle pieces have to fit together into any sort of comprehensible, indisputable larger picture.
What poverty of thought that is, what a barren wasteland, an infinity of random and unconnected details about the world that need make no sense. Is this not a recipe for confusion, a path to alienation and despair? How can one move through a world, an existence, where anything is free to change from moment to moment, where nothing can be expected to be predictable, let alone understandable?
For me, nothing rivals the majestic unity of the natural world.
__________
* [note added 25 august 2008] Or maybe it was this version that Richard Dawkins attributes to J.B.S. Haldane that I was mentally grasping at: “Now, my own suspicion is that the universe is not only queerer than we suppose, but queerer than we can suppose. I suspect that there are more things in heaven and earth than are dreamed of, or can be dreamed of, in any philosophy.”
Aug
11
Posted by jns on 11 August 2008

This is Georg Cantor (1845–1918), the German mathematician who advanced set theory into the infinite with his discovery/invention of transfinite arithmetic. Why I hedge over “discovery” or “invention” we’ll get to in a moment.
I first encountered Cantor’s ideas in college in my course of “mathematical analysis”, which was largely concerned with number theory. I remember the stuff we worked on as beautiful but nearly inscrutable, and very dense: our textbook was less than an inch thick but the pages were dark with mathematical symbols, abbreviations, and shorthand, so that a semester was much too short a time to get through the whole thing.
Cantor proved a series of amazing things. First, consider the positive integers (or natural numbers, or whole numbers, or counting numbers): 1, 2, 3, 4, etc. We know that there is no largest integer because, if there were, we could add 1 to it to get one larger. Therefore, the set of positive whole numbers is infinite. This is also described as a countable, or denumerable infinity, because the elements of the set can be put into a one-to-one correspondence with the counting numbers–a rather obvious result because they are the counting numbers and can thus be counted. Think of counting and one-to-one correspondence for a bit and is becomes obvious (as the textbooks are wont to say) that the set of positive and negative integers (…,-3, -2, -1, 0, 1, 2, 3, …) is also a countable infinity, i.e., there are just as many positive and negative integers as there are positive ones. (This is transfinite arithmetic we’re talking about here, so stay alert.)
Next to consider is the infinity of rational numbers, or those numbers that can be written as the ratio of two whole numbers, i.e., fractions. How infinite are they compared to the whole numbers?
Cantor proved that the cardinality of the rational numbers is the same as that of the whole numbers, that the rational numbers are also denumerable. For his proof he constructed a system of one-to-one correspondence between the whole numbers and the rationals by showing how all of the rational numbers (fractions) could be put into an order and, hence, counted. (The illustration at the top of this page shows how the rationals can be ordered without leaving any out.)
Any set whose elements can be put into a one-to-one correspondence with the whole numbers, i.e., that can be counted, contains a countable infinity of elements. Cantor gave a symbol to this size, or cardinality, or infinity, calling it  (said “aleph nought”), using the first letter of the Hebrew alphabet, named “aleph”.
Then there are the irrational numbers, numbers that cannot be written as ratios of whole numbers. The square root of 2 is a famous example; discovery of its irrationality is said to have caused great consternation among Pythagoreans in ancient times. There are several interesting classes of irrational numbers, but for this consideration it is enough to say that irrational numbers have decimal expansions that never terminate and whose digits never repeat.  , the ratio of the circumference to the diameter of a circle is a famous irrational number and many people are fascinated by its never ending decimal representation.
Cantor proved that the cardinality of the real numbers (rational and irrationals put together) is greater than — they cannot be counted. He proved this with his diagonalization technique, in which he showed that no matter how many rational numbers were packed into an interval one more could always be constructed that was not in that set.* (For the proof, see this Wikipedia page; it’s not a difficult proof to read but it takes a clear head to understand it.)
Cantor referred to the real numbers as the continuum because it was so dense with numbers. Cantor had shown that the cardinality of the continuum was strictly larger than the cardinality of the whole numbers. Now we have two sizes of infinity, if you will! There are more, but we’ll stop there.
Cantor was haunted by being unable to prove something he believed to be true, known as the “continuum hypothesis”. In words the conjecture is that there is no cardinality of infinity between the cardinality of the countable infinity and the cardinality of the real numbers. When he’d reached this stage Cantor’s mental health faced severe challenges and he became obsessed with trying to prove that Francis Bacon wrote the plays of Shakespeare. A decade after Cantor died Kurt Gödel proved that the Continuum Hypothesis was a formally undecidable proposition of set theory, that it could neither be proved or disproved.
Much of this story appeared in one book I finished recently: Amir D Aczel, The Mystery of the Aleph : Mathematics, the Kabbalah, and the Search for Infinity (New York : Four Walls Eight Windows, 2000, 258 pages). My book note is here.
Just after that book I finished another book on a mathematical topic: Mario Livio, The Golden Ratio : The Story of Phi, The World’s Most Astonishing Number (New York : Broadway Books, 2002, viii + 294 pages). Its book note is here.
Aside from their interest in mathematical topics, the two books have very little in common with one exception: both authors ruminated on the question whether mathematics is created or discovered, whether the great edifice exists only in the minds of humans or whether it somehow has an independent existence in the universe independent of the human mind. The complication to the question of course is the remarkable utility of mathematics when it comes to explaining how the universe works.
I once had a long-time debate with my roommate in graduate school on the question. I remember winning the debate after months, but I forget which side I argued. It’s the sort of thing that physics and philosophy graduate students argue about.
Oddly to me, aside from the vague coincidence that two books I should read back-to-back considered this question,† is that each author felt very strongly about the answer to the question, feeling that his answer was the obvious best choice, but, as you’ve guessed, one believed that mathematics was obviously discovered and the other felt that mathematics was clearly invented.
Even as I once argued that mathematics was obviously discovered, I realized from reading these two authors’ discussions that I now pretty much would go with the conclusion that mathematics is an invention of the human mind. Now, how that could be and still have mathematics accord so well with the operating of the universe is a question that I’m afraid goes well beyond the scope of this already too long posting.
Besides, the hour grows late and my mind lacks the clarity to be convincing right now. So, as a distraction, I leave you thinking about the much simpler question of how one type of infinity can be larger than another.
__________
* Think very carefully about the distinction between not being able to think of a way to count the set versus proving that there is no way it can be done.
† Not so surprising, really, if you consider the fact that when I’m browsing for books on the library stacks I’ll frequently find more than one on a single shelf that looks interesting.
Aug
04
Posted by jns on 4 August 2008
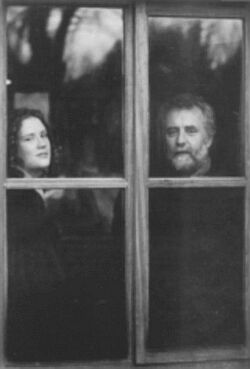 This is David Flannery, a lecturer in mathematics at the Cork Institute of Technology, Cork, Ireland. He is shown with his daughter Sarah Flannery, author of the book In Code : A Mathematical Journey (New York : Workman Publishers, 2001); David Flannery is listed as her coauthor.
The book is a fascinating, entertaining, and instructive one, blurbed on the jacket as “a memoir with mathematics”. It’s Sarah’s autobiographical account of her route to winning some prestigious young scientist awards in 1998 and 1999 with a good dose of mathematical fun and really good writing about the mathematical ideas at the core of public-key cryptography, if you can imagine such a thing. I enjoyed reading it very much and I think a lot of other people might enjoy it too. Here’s my book note.
Okay, so her coauthor and father happens to have a very lovely beard, but it’s all just a pretext for passing along an interesting problem and its lovely solution from an appendix of the book. I’m sure this surprises no one here.
In America this statistical brain-teaser tends to be known as the “Let’s Make a Deal” problem. Imagine you’re playing that game. Host Monty presents you with three doors: behind one is a wonderful and expensive new car, behind the other two nothing of much value. You chose one door at random. Host Monty then opens one of the two remaining doors, revealing an item of little value.
Do you change your initial choice?
Most of us who’ve done some statistics are suckered into saying “no” at first because we think that the probability of our having made the correct choice has not changed. However, it has indeed changed and a more careful analysis says we should always choose the other door after Monty opens the door of his choice. One can perhaps go along with that by realizing that Monty did not choose his door at random–he knows where the car is and he chose not to reveal the car, so the information we have at our disposal to make our “random” choice has changed.
However, seeing this clearly and calculating the attendant probabilities is neither easy nor obvious–usually. I’ve read several solutions that typically say something like “look, it’s simple, all you have to do….” and they go on to make inscrutable statements that don’t clarify anything.
The answer in Flannery’s book is the clearest thing I’ve ever read on the subject; the reasoning and calculation itself by one Erich Neuwirth is breathtaking in its transparency. From “Appendix B: Answers to Miscellaneous Questions”, this is her complete response to the question “Should you switch?”
Yes. In order to think clearly about the problem get someone to help you simulate the game show with three mugs (to act as the doors) and a matchstick (to act as the car). Close your eyes and get your helper to hide the matchstick under one of the mugs at random. Then open your eyes, choose a mug and let your helper reveal a mug with nothing under it. Play this game many times, and count how often you win by not switching and how often by switching.
The following explanation of the answer “Yes, you should switch” is from Erich Neuwirth of Bad Voeslau, Austria, and appears on page 369 of the Mathematical Association of America’s The College Mathematics Journal, vol. 30, no. 5, November 1999:
“Imagine two players, the first one always staying with the selected door and the second one always switching. Then, in each game, exactly one of them wins. Since the winning probability for the strategy “Don’t switch” is 1/3, the winning probability for the second one is 2/3, and therefore switching is the way to go.” [pp. 302--303]
Do you see the reason? Because one player always wins, the individual probabilities of each player’s winning must add up to 1. The probability of a win for the “Don’t switch” player is obviously 1/3 (1 of 3 doors chosen at random), so the probability of a win for the “Always switch” player must be 1 – 1/3 = 2/3. Brilliant!