27
It Was Hot
Posted by jns on September 27, 2010Well, how nice. Our area of the country, greater Washington DC, has been acclaimed by The Weather Channel as having had the worst summer of any major area in the US in 2010 (Jon Erdman, Tim Ballisty and Chris Dolce, “Top 5 Worst Summers“, not dated/accessed 24 September 2010). There are several extreme conditions, like storms and drought, that were part of their judgement, but heat was a big factor, of course. The big factor was the one that I noticed myself, namely the number of days when the high temperature was over 90 F.
I had the impression, as early as the beginning of July, that we were having an unusual number of days at a time with temperatures over 90 F. That obviously led to the question of whether my impression was correct that, in my memory, we rarely had more than, say, two days in a row so hot, maybe one week a summer with each day so hot, but not endless strings of days over 90 F and close to, if not exceeding, 100 F. (That latter only happened on about three days, which is more typical.)
Phew, I wasn’t just imagining it:
The summer of 2010 was a scorcher in many parts of the world, including the eastern U.S., where Washington, D.C. and New York, N.Y. broke records for their warmest summer since recordkeeping began. According to the Washington Post’s “Capital Weather Gang” blog, (full discosure: I write a weekly climate science column for that site) this year marked the first time that city has experienced an average summer high temperature that was greater than 90 degrees Fahrenheit. Temperatures in D.C. reached or exceeded the 90 degree threshold on 52 days during June, July, and August, which together comprise the meteorological summer months. The average low temperature this summer was also far above average in D.C., with 71 days having had a low temperature of 70 degrees or higher, the Post reported.
[Andrew Freedman, "Warmest Summer on Record for DC and New York", Climate Central, 1 September 2010.]
Now, there are interesting questions we might consider about just what it means to say this was our “hottest” summer. Average high temperatures, average low temperatures, number of days above a certain temperature, and others. These are derive, really, from the idea that it’s very hard to describe a statistical population with a single statistic, like an “average”, although that rarely impedes our attempts to do so.
But number of days over 90 F is useful (similar to a median measurement) and it was certainly noticeable to me. Any temperature in the 70s seems mostly comfortable to me, the 80s generally feel “warm” to me, but cross 90 F and the air feels “hot” to me. The good part, I suppose, is that once it’s “hot” I wilt but it doesn’t much matter to me whether it’s 95 F or 105 F.
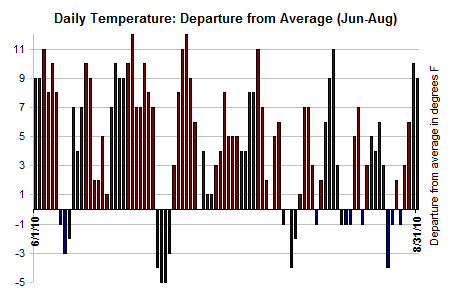
Here’s another interesting way to look at this idea of “hotter summer”. This graph takes each day’s “average temperature” (itself a slippery concept) [source] against a 30-year average and reporting the difference, showing us that most days were notably hotter than “average”:
It doesn’t provide relief from the heat, but I get some sense of vindication out of it.