02
Two Benfords
Posted by jns on 2 April 2009 This is physicist and science-fiction author Gregory Benford. His official website, source of the photograph, tells us that
Benford [born in Mobile, Alabama, on January 30, 1941] is a professor of physics at the University of California, Irvine, where he has been a faculty member since 1971. Benford conducts research in plasma turbulence theory and experiment, and in astrophysics.
Around 1990, the last time I was on a sci-fi binge, I read a number of his books; I see from the official list of novels that I’m behind by a number of books. I should pick up where I left off. I remember Benford’s writing as being very satisfactory from both a science viewpoint and from a fiction viewpoint, although I find that, in my mind, I confuse some of the story-memory details with plots by the late physicist and sci-fi author Charles Sheffield, to whom I give the edge in my preference for hard-science-fiction and adventuresome plots.
But, as is not unprecedented in this forum, Mr. Benford is really providing a pretext–a worthwhile pretext on several counts, clearly, but a pretext nonetheless, because I wanted to talk about “Benford’s Law” and that Benford did not wear a beard.
Frank Benford (1883-1948) was a physicist, or perhaps an electrical engineer–or perhaps both; sources differ but the distinctions weren’t so great in those days. His name is attached to Benford’s Law not because he was the first to notice the peculiar mathematical phenomenon but because he was better at drawing attention to it.
I like this quick summary of the history (Kevin Maney, “Baffled by math? Wait ’til I tell you about Benford’s Law“, USAToday, c. 2000)
The first inkling of this was discovered in 1881 by astronomer Simon Newcomb. He’d been looking up numbers in an old book of logarithms and noticed that the pages that began with one and two were far more tattered than the pages for eight and nine. He published an article, but because he couldn’t prove or explain his observation, it was considered a mathematical fluke. In 1963, Frank Benford, a physicist at General Electric, ran across the same phenomenon, tried it out on 20,229 different sets of data (baseball statistics, numbers in newspaper stories and so on) and found it always worked.
It’s not a terribly difficult idea, but it’s a little difficult to pin down exactly what Benford’s Law applies to. Let’s start with this tidy description (from Malcolm W. Browne, “Following Benford’s Law, or Looking Out for No. 1“, New York Times, 4 August 1998):
Intuitively, most people assume that in a string of numbers sampled randomly from some body of data, the first non-zero digit could be any number from 1 through 9. All nine numbers would be regarded as equally probable.
But, as Dr. Benford discovered, in a huge assortment of number sequences — random samples from a day’s stock quotations, a tournament’s tennis scores, the numbers on the front page of The New York Times, the populations of towns, electricity bills in the Solomon Islands, the molecular weights of compounds the half-lives of radioactive atoms and much more — this is not so.
Given a string of at least four numbers sampled from one or more of these sets of data, the chance that the first digit will be 1 is not one in nine, as many people would imagine; according to Benford’s Law, it is 30.1 percent, or nearly one in three. The chance that the first number in the string will be 2 is only 17.6 percent, and the probabilities that successive numbers will be the first digit decline smoothly up to 9, which has only a 4.6 percent chance.
Take a long series of numbers drawn from certain broad sets, and look at the first digit of each number. The frequency of occurrence of the numerals 1 through 9 are not uniform, but distributed according to Benford’s Law. Look at this figure that accompanies the Times article:
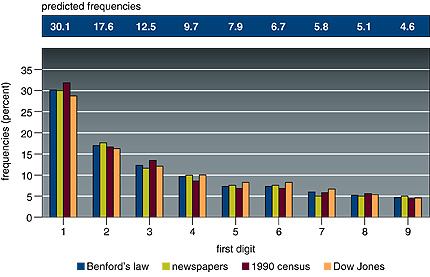
Here is the original caption:
(From “The First-Digit Phenomenon” by T. P. Hill, American Scientist, July-August 1998)
Benford’s law predicts a decreasing frequency of first digits, from 1 through 9. Every entry in data sets developed by Benford for numbers appearing on the front pages of newspapers, by Mark Nigrini of 3,141 county populations in the 1990 U.S. Census and by Eduardo Ley of the Dow Jones Industrial Average from 1990-93 follows Benford’s law within 2 percent.
Notice particularly the sets of numbers that were examined for the graph above: numbers from newspapers (not sports scores or anything sensible, just all the numbers from their front pages), census data, Dow Jones averages. These collections of numbers do have some common characteristics but it’s a little hard to pin down with precision and clarity.
Wolfram Math (which shows a lovely version of Benford’s original example data set halfway down this page) says that “Benford’s law applies to data that are not dimensionless, so the numerical values of the data depend on the units”, which seems broadly true but, curiously, is not true of the original example of logarithm tables. (But they may be the fortuitous exception, having to do with their logarithmic nature.)
Wikipedia finds that a sensible explanation can be tied to the idea of broad distributions of numbers, a distribution that covers orders of magnitude so that logarithmic comparisons come into play. Plausible but not terribly quantitative.
This explanation (James Fallows, “Why didn’t I know this before? (Math dept: Benford’s law)“, The Atlantic, 21 November 2008) serves almost as well as any without going into technical details:
It turns out that if you list the population of cities, the length of rivers, the area of states or counties, the sales figures for stores, the items on your credit card statement, the figures you find in an issue of the Atlantic, the voting results from local precincts, etc, nearly one third of all the numbers will start with 1, and nearly half will start with either 1 or 2. (To be specific, 30% will start with 1, and 18% with 2.) Not even one twentieth of the numbers will begin with 9.
This doesn’t apply to numbers that are chosen to fit a specific range — sales prices, for instance, which might be $49.99 or $99.95 — nor numbers specifically designed to be random in their origin, like winning lottery or Powerball figures or computer-generated random sums. But it applies to so many other sets of data that it turns out to be a useful test for whether reported data is legitimate or faked.
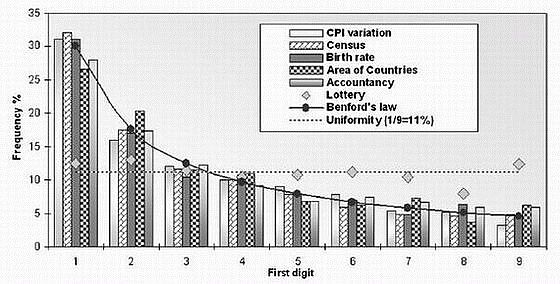
Here’s yet another graph of first digits from vastly differing sets numbers following Benford’s Law (from Lisa Zyga, “Numbers follow a surprising law of digits, and scientists can’t explain why“, physorg.com, 10 May 2007); again one should note the extreme heterogeneity of the number sets (they give “lottery” results to show that, as one truly wants, the digits are actually random):
The T.P. Hill mentioned above (in the caption to the first figure), is a professor of mathematics at Georgia Tech who’s been able to prove some rigorous results about Benford’s Law. From that institution, this profile of Hill (with an entertaining photograph of the mathematician and some students) gives some useful information:
Many mathematicians had tackled Benford’s Law over the years, but a solid probability proof remained elusive. In 1961, Rutgers University Professor Roger Pinkham observed that the law is scale-invariant – it doesn’t matter if stock market prices are changed from dollars to pesos, the distribution pattern of significant digits remains the same.
In 1994, Hill discovered Benford’s Law is also independent of base – the law holds true for base 2 or base 7. Yet scale- and base-invariance still didn’t explain why the rule manifested itself in real life. Hill went back to the drawing board. After poring through Benford’s research again, it clicked: The mixture of data was the key. Random samples from randomly selected different distributions will always converge to Benford’s Law. For example, stock prices may seem to be a single distribution, but their value actually stems from many measurements – CEO salaries, the cost of raw materials and labor, even advertising campaigns – so they follow Benford’s Law in the long run. [My bold]
So the key seems to be lots of random samples from several different distributions that are also randomly selected: randomly selected samples from randomly selected populations. Whew, lots of randomness and stuff. Also included is the idea of “scale invariance”: Benford’s Law shows up in certain cases regardless of the units used to measure a property–that’s the “scale” invariance–which implies certain mathematical properties that lead to this behavior with the logarithmic taste to it.
Another interesting aspect of Benford’s Law is that it has found some applications in detecting fraud, particularly financial fraud. Some interesting cases are recounted in this surprisingly (for me) interesting article: Mark J. Nigrini, “I’ve Got Your Number“, Journal of Accountancy, May 1999. The use of Benford’s Law in uncovering accounting fraud has evidently penetrated deeply enough into the consciousness for us to be told: “Bernie vs Benford’s Law: Madoff Wasn’t That Dumb” (Infectious Greed, by Paul Kedrosky).
And just to demonstrate that mathematical fun can be found most anywhere, here is Mike Solomon (his blog) with some entertainment: “Demonstrating Benford’s Law with Google“.